
Recruitment funnel dashboards
Applicants, screens, submittals, interviews, offers and placements by role, client, source and recruiter.

See utilization, pipeline, placements and margin in one place, with forecasts that show next month before it arrives. Built on your ATS, CRM, timesheet and accounting data.
Ask a recruitment agency director how many placements will close this month and you'll often get a guess. The data exists, but it is split across the ATS, the CRM, spreadsheets and the finance system, and pulling it together takes days. Recruitment analytics brings it into one place: source-to-placement funnels, time to fill, submittal-to-interview ratios, recruiter activity and revenue by client, updated daily instead of at month end.
Consultancies, accounting practices and agencies face the same gap. Professional services analytics combines timesheets, project plans, CRM pipeline and invoicing to show utilization by person and team, realization against rate cards, project margins and work in progress. Utilization analytics shows who is overbooked and who is on the bench before it turns into a missed deadline or an idle month.
On top of clean data we add prediction. Pipeline forecasting estimates which deals and roles are likely to close and when, so you can plan hiring and capacity. Talent analytics shows which sources produce placements that last, and where candidates drop out of your process. We built an admin analytics panel for AA JoyLand that tracks chatbot conversations and leads, and lead-qualification chatbots like the one we built for CanVisas produce structured data on every enquiry that can flow into the same dashboards. Every project uses role-based access, so salary, candidate and client data is visible only to the people who need it.
Applicants, screens, submittals, interviews, offers and placements by role, client, source and recruiter.
Billable versus non-billable hours by person, team and practice, tracked against targets.
Predicts likely closes for deals and open roles, with expected revenue and timing.
Shows which sources, job boards and campaigns produce candidates who get hired and stay.
Compares hours, rates and invoices to show which engagements and clients actually make money.
Matches upcoming project demand with available consultants so you can staff or hire early.
People, clients, projects, roles and invoices linked in a single warehouse.
Partners see the firm, managers see their team and recruiters see their own desk.
Pipeline, placement and utilization forecasts built on your own history, with ranges rather than single guesses.
Ask "which clients had the lowest realization last quarter?" and get the answer with a chart.
Row-level security, masking of salary and personal data, and logs of who viewed what.
Weekly partner packs and daily recruiter scorecards produced without manual exports.
Using something else? If it has an API, a database or a webhook, we can connect to it.
Leaders see revenue and placements forming during the month, not after it.
Utilization data shows where to move work before people burn out or sit idle.
Budget moves to the job boards and channels that produce real hires.
Partners, finance and recruiters debate decisions, not whose spreadsheet is right.
AA JoyLand Entertainment required an AI-powered solution to handle customer inquiries and leads more efficiently. The project focused on developing a WhatsApp chatbot powered by Retrieval-Augmented Generation (RAG) with GPT, capable of managing leads, qualifying them, and saving lead data. The chatbot provided instant responses, sent PDFs upon request, and significantly enhanced customer interaction.
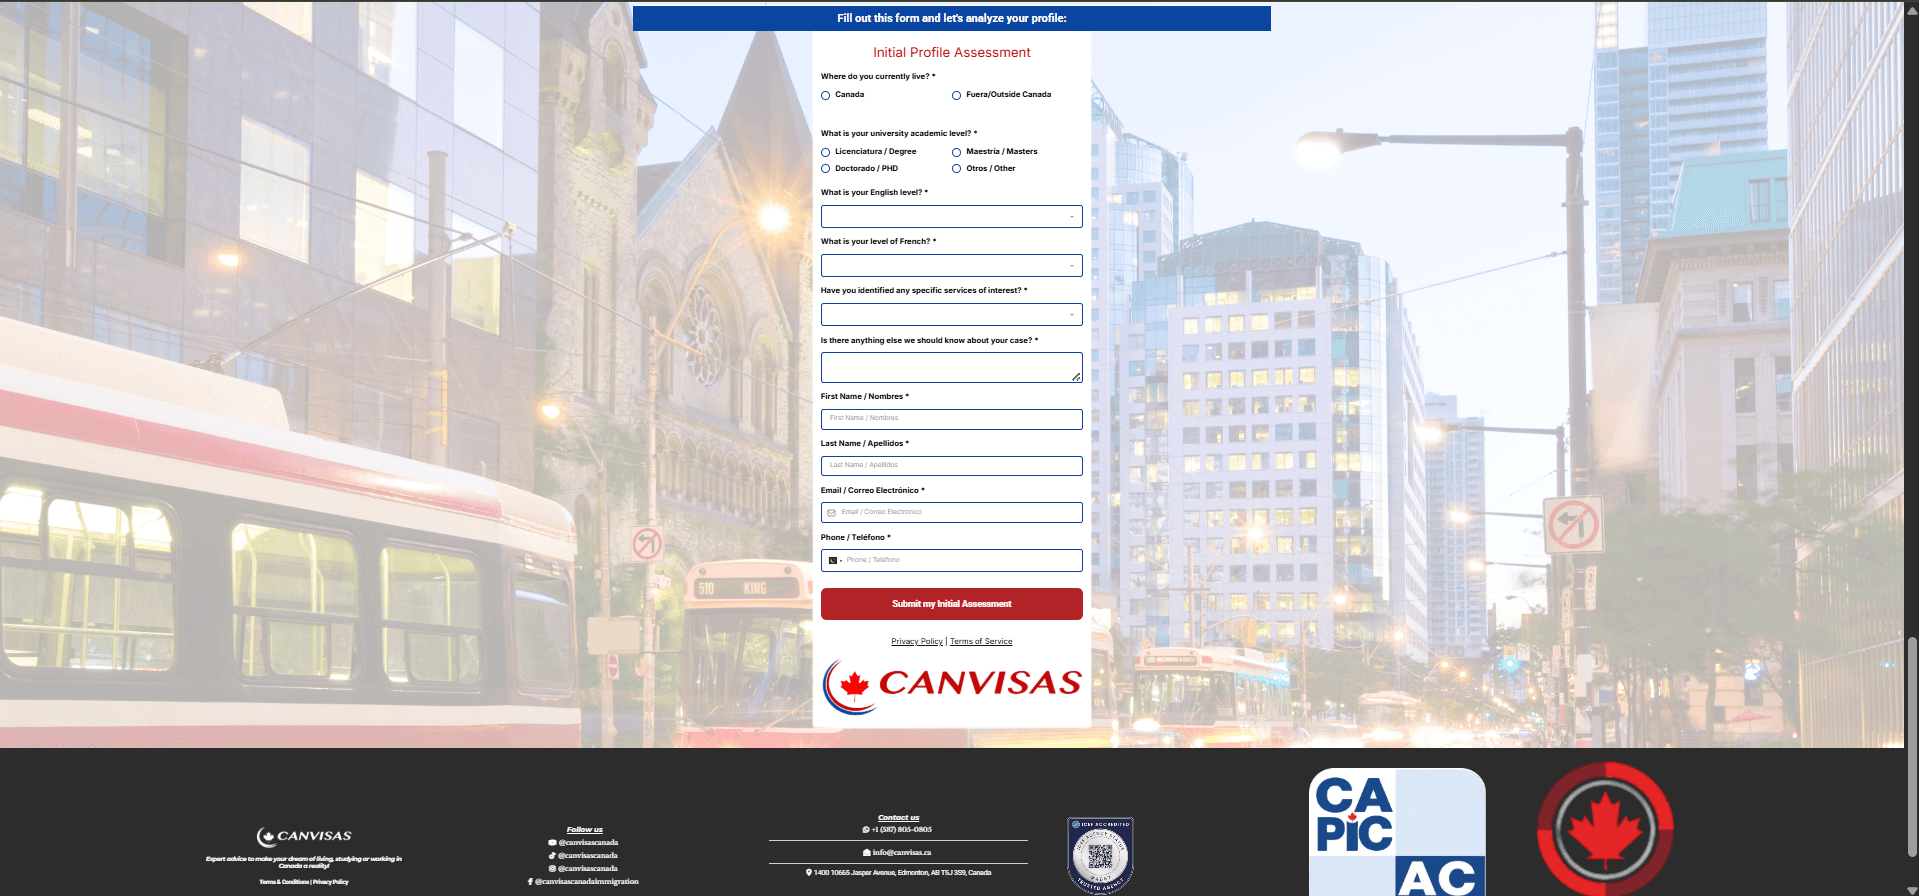
CanVisas AI is an intelligent chatbot that helps users check their eligibility for Canadian permanent residence through simple conversations. The chatbot asks pre-screening questions about immigration requirements and provides instant eligibility assessments. It qualifies leads by gathering important information before connecting them with the CanVisas team.
It's the measurement of your hiring funnel and recruiter performance: sources, time to fill, conversion between stages, placements and revenue. Agencies use it to see where candidates drop out and which clients and recruiters drive results.
It tracks how much of each person's available time is billable, against targets, by person, team and practice. Combined with realization and margin, it shows whether the firm is busy on the right work.
Yes. We build pipelines from tools like Bullhorn, HubSpot, Salesforce, QuickBooks and Xero into one warehouse, and match clients and projects across them.
It depends on how much history you have and how consistently stages are recorded. We test forecasts against your past months before you rely on them, and show a range of likely outcomes rather than one number.
Yes. We can deliver dashboards in Power BI or Excel, or build a custom web dashboard if you also want to share views with clients.
Sensitive fields are masked or restricted with row-level security, all access is logged, and data can stay in your own cloud and region to meet GDPR or PDPL requirements.
AI phone screening for candidates, interview scheduling calls and an AI receptionist that books discovery calls for consultants.
Explore AI ChatbotsLead qualification, immigration eligibility, candidate and HR chatbots on web and WhatsApp, grounded in your own content.
Explore AI AutomationAI resume screening, client onboarding and KYC automation, document chasing and proposal drafting, with people approving every decision.
Explore Custom AI DevelopmentCustom AI recruiting software, candidate matching engines, knowledge assistants over past project files and HR tech MVPs.
ExploreBring an export from your ATS or timesheet tool. We'll show you what a live utilization and pipeline view would look like for your firm.